Angelina Ha ’26 and Zimon Li ’26 : The Waikar Lab
- The Rivers School

- Sep 12, 2025
- 7 min read

Nephrology, the study of kidney function and disease, plays an important role in managing chronic illnesses, yet one of its most persistent challenges remains the delayed detection of kidney damage. Tucked behind our lower ribs, these bean-shaped organs filter nearly 50 gallons of blood each day, regulating everything from electrolytes and blood pressure to waste removal and hydration. Chronic kidney disease (CKD) is often asymptomatic in its early stages, with progressive nephron loss going undetected until irreversible damage has occurred. Currently, serum creatinine is the standard biomarker used to assess kidney function. While widely used, it lacks sensitivity in the early stages of disease, as elevated creatinine levels often reflect significant and already-established kidney injury.
Recent efforts in kidney research have turned towards the validation and identification of novel biomarkers capable of detecting pathological changes earlier and more accurately. These markers, which include proteins involved in inflammation, fibrosis, and tubular injury, offer a promising path toward improving early diagnosis in CKD.
To explore this potential, we are using the Meso Scale Discovery (MSD) platform, an electrochemiluminescence-based assay system that enables multiplexed, high-sensitivity detection of biomarkers from small sample volumes. The MSD platform allows us to detect levels of different biomarkers in samples by converting light signals to concentrations in pg/ml. Using human urine specimens, our goal was to evaluate panels of candidate biomarkers to determine their ability to detect CKD at earlier stages than traditional measures.

Before we arrived at the lab, we were expected to complete lab safety training courses before dealing with any of the materials or biospecimens. These trainings were completed to ensure that we had the appropriate instruction when it came to hazards in the lab, such as human samples, chemical hazards, corrosives, or flammable substances. We were then introduced to the lab group and given a tour of the lab to familiarize ourselves with the location of all the materials.


Patient samples in the -80 °C fridge MSD materials in the ‘Cold Room’
Before we ran our independent MSD assays, we practiced essential pipetting techniques to ensure accuracy with small volumes. Working in microliters required careful handling, and we were trained in reverse pipetting to improve consistency. We also used multichannel pipettes to load all plate-related volumes efficiently and consistently. Preparing the standards involved precise serial dilutions, where technique and attention to detail were critical for reliable results.
During the early days of our time at the lab, we spent most of our time observing either Nathan Pan, a college intern, or Kajal Kamboj, a post-doc, running partial MSD assays. We observed the washing of MSD plates, preparing standards, diluting samples, using the MSD software, and analyzing MSD data.
Before performing an MSD Assay, we needed to modify the protocol based on the number of wells we would use. We also need to create the plate layout for which wells will be samples versus standards.
For the MSD Assay, we first had to wash the plate fresh out of the ‘Cold Room’ before adding any antibodies. This ensures the plate is clean before we add any media to the wells. We then add the ‘Primary Capture Antibody’ that is specifically linked to a certain spot on the wells to attach to the antibody. After we add the standards or samples. To create the standards, we dilute the calibrator standards down, and we calculate the values of picograms per milliliter for each dilution of the standards. To do this, we transfer media from the previous standard to the next. We also dilute the samples to ensure the amount of biomarker lies within the detection range of the MSD machine. For some cases, we had to dilute the sample 100 times, and to ensure accuracy, we had to transfer the sample to a dilution of 20X and then dilute it five more times to get a dilution of 100X. Then we add these standards and samples to the plate itself.
The next step would be to add the detection antibody with the Sulfo-tag, which creates this “sandwich” around the analyte. The Sulfo-tag produces a light that the MSD machine reads and converts that light into data based on concentration, signal, and coefficient of variance (CV). For the standards, we create duplicates of each standard to estimate the coefficient of variance. This number shows us the percentage difference between the standards between each other, giving us an understanding of our error during the process. Similarly, for the samples, we often do duplicates, triplicates, or quadruplicates to also check for the CV. We aim to keep the CV under 10, which better validates our results.


MSD Protocol Washing Plate


Loading standards and samples into the MSD Plate Analyzing MSD data
In addition to being in the lab, we had the opportunity to observe a kidney biopsy. We prepared a cart for all the materials needed to examine and preserve the kidney biopsy. Once we arrived, we assisted Courtney Huynh, the Waikar Lab’s Research Program Manager, and the other people there with setting up and preparing for the patient. The patient lay on his stomach as the doctor mapped the kidney’s position via ultrasound, locating the optimal puncture site. A local anesthetic numbs the area before a thin, spring-loaded needle swiftly penetrates the skin. In seconds, a tiny tissue core is extracted. The sample is preserved for either research or diagnostics, as decided by the pathologist, while the patient rests under observation.

With so many different types of media and samples, Kajal and Courtney taught us about the different areas of storage and how the lab manages their inventory. In the ‘Cold Room’, many of the MSD media and materials are stored at -20 degrees Celsius. Patient samples are stored in the -80 fridge for long-term preservation. At our bench, there is a -20 degree fridge where we sorted and tracked expiration dates, ID numbers, and condition of various diluents and organized them within Excel.


-80 degree fridge -20 degree fridge at bench
Zimon’s Experiments:
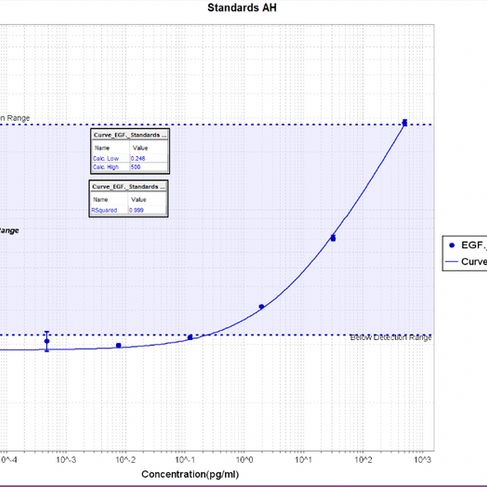
For my first trial of just EGF Standards, I had minimal standard deviation because my CVs were good and most of my points lay within the detection range. This means between the two wells of each standard, my error was relatively low. My fit statistics were 0.999, which is optimal, and my relative low and high were 0.340 and 500, respectively, indicating that this experiment was strong in its data.


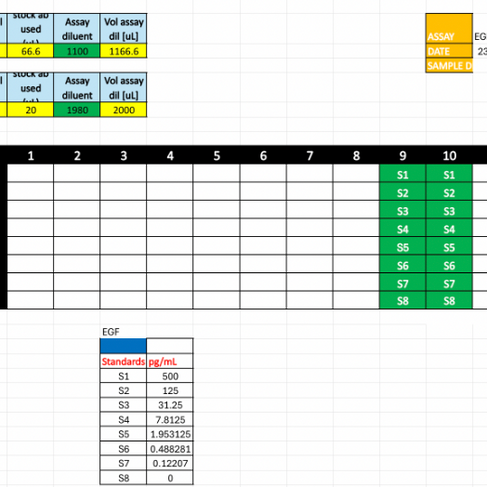
Graph of Trial 1 EGF Plate Layout of Trial 1 EGF
For my second trial, my standard deviation was higher, and so were my CVs. This is most likely due to the changed method of pipetting and preparation of standards. However, most of my points still landed within the detection range, and the relatively high and low values were within reason, so this experiment is still valid to show the average graph of EGF standards.

For my final experiment, I tested KIM-1 Standards and two different samples, QC08 and QC13.
The layout for the standards was consistent with previous runs. However, the samples were diluted 10 times collectively and triplicated, and then an extra two were added in the last two wells, alternating.

For my graph, my standards all fell within the detection range, and they had minimal CVs and standard deviation. The relative high and low as well as the fit statistics were similar to previous experiments, which validates the graph of my KIM-1 standards. The urine samples (which are QC08 and QC13) are parallel with the line created by the standards. Their CVs were also below 5 shown by the minimal distance between the two points, showing that the quadruplets were done with minimal error.


Angelina’s experiments:
For our first independent MSD assay, we ran EGF (Epidermal Growth Factor) standards without any samples.


Graph of Trial 1 EGF Plate Layout of Trial 1 EGF
In my first MSD assay run using standards, a considerable portion of the signal values fell below the assay’s detection limit. However, the coefficient of variance (CV) between the values of the duplicated standards was relatively low, reflecting the accuracy between the wells.

In my second trial using the same EGF standard protocol, the majority of signal values fell within the assay’s detection range, demonstrating a clear improvement from the first run. Additionally, the coefficients of variation were relatively low, indicating precision and consistency in pipetting technique.
For my final MSD assay, I quantified EGF levels in two human urine samples to assess biomarker presence and assay performance in bio-specimens.

The layout of the standards in the MSD plate was consistent with previous runs; however, this assay differed in the inclusion of human urine samples. QC08 and QC13, collected from patient specimens, were diluted 100-fold using a two-step serial dilution to reduce pipetting error and maintain accuracy at low volumes.


The graph displays the patient urine samples plotted against the standard curve, which serves as a reference for quantifying EGF concentrations. Both QC08 and QC13 fall within the detection range and align well with the standard curve, indicating reliable interpolation. The samples fall near the middle of the curve, which is ideal for assay accuracy and sensitivity. QC13 had a high CV, especially compared to QC08, but this result is also somewhat expected with artificially high coefficients of variation being common, in especially low concentrations.
Between both of our experiments, we created a table that summarized our results pertaining to our respective biomarkers between the two patient samples.

EGF (epidermal growth factor) is found to have depleted levels in patients with CKD, with a mean range of around 500-4,000 pg/ml in human urine. On the contrary, KIM-1 (Kidney Injury Molecule 1) is expected to have elevated levels in CKD patients with concentrations greater than 100 pg/ml. Based on our data, we both reached the conclusion that while both patients QC08 and QC13 had CKD (based on our biomarker values), QC08 fell into the early-mid stage CKD, while QC13 fell into the mid-advanced stage CKD. The correlation across our results helped validate the efficacy of both of our biomarkers in determining the kidney disease progression in patients based on calculated concentrations in human urine.
Using the MSD platform, we learned how to measure kidney biomarker concentrations in patient samples with accuracy and saw firsthand why emerging biomarkers are valuable for detecting issues earlier than traditional tests. We also gained a clearer understanding of the kidney biopsy process, including the detailed preparation required to ensure safe and reliable results. In the lab, we refined techniques to maintain precision at every step, knowing the impact this has on both research quality and patient outcomes. Overall, the experience highlighted the close connection between research and patient care, as well as the need to remain adaptable when navigating the challenges of scientific work.
Thank you to everyone in the Waikar Lab for welcoming us and making this such a meaningful and educational experience. A special thank you to Mr. Schlenker for making this opportunity possible, Dr. Waikar for his leadership, Dr. Kajal Kamboj for guiding us closely in our work, and Courtney for coordinating everything and keeping us on track throughout the internship—we are truly grateful.


Comments